Wednesday, April 8, 2015

What Benefit Do IPC Standards Have For The Electronic Hardware Supply Chain?

For more than 50 years, IPC has developed industry standards for the production of electronic hardware. After having been long considered North American standards, IPC standards over the past two decades have spread globally. The question now is: what benefit do IPC standards have for the electronic hardware supply chain?


Providing answers to that question, several companies in Europe representing electronic design, CAD, bare board production, assembly and soldering explain how they use IPC standards in their daily business routines.


This first article covers electronic design/CAD company, GED GmbH, located 30 km southeast of Cologne in Germany.


First experience with IPC standards


GED offers PCB design and engineering and, through the assistance of external subcontractors, bare board, assembly and test services. Currently the company has 14 employees and CAD systems from six different layout vendors. With these resources, the company produces 160 new PCBs and 80 updates per year for rigid, flex, flex-rigid and HDI boards for customers in Germany, Italy, Sweden, the Netherlands, France and the Czech Republic.


From its establishment in 1986 to the middle of the 1990s, the company used its customers’ internal standards from companies such as Siemens, Philips, Rheinmetall and Thyssen. This meant that a different standard was used for every customer. An example of this frustrating situation, says Hanno Platz, owner and managing director, “was when we received an inquiry from Hewlett Packard in Germany with an attachment of 100 pages of requirements for the PCB in question.” At that time, the staff did not know about IPC and its standards. In 1995, the company had a U.S. customer that demanded that the assembly and soldering of a back plane, developed and produced in Germany, be conducted at their U.S. premises according to IPC-A-610, Acceptability of Electronic Assemblies, Class 3 acceptance criteria.


Technology focused on standards


GED found IPC standards through FED, a local German organization with a long-time relationship with IPC, and bought first set of IPC standards. The back plane could now be designed and produced according to IPC standards. Having standards from different areas of the production chain that linked together was a new and positive experience for the company. The staff now regularly discusses how to use IPC standards in their own designs as well as in the purchasing process of bare boards plus assembling and soldering.


Currently, all employees have passed CID (Certified Interconnect Designer) and CID+ (Advanced Certified Interconnect Designer) and are familiar with nearly all IPC standards for electronic design and CAD. All of their order acknowledgments for designing a complete PCB include the following statement, “If nothing else has been agreed upon, PCBs will be manufactured according to IPC standards and its Class 2 acceptance criteria.”


At GED, designers also create PCB layouts. Today, most new PCBs are HDI (high density interconnected) with a high SI (signal integrity) level including high EMC (electromagnetic compatibility). IPC standards have an important influence on these complex boards. The company uses the following IPC standards in their design work:


  • The IPC-2220 PCB design series for mechanical properties of track, isolation and PTH (plated-through holes)

  • IPC-2223B, Sectional Design Standard for Flexible Printed Boards for flex-rigid PCBs and questions like adhesive type, placement of a flex layer into the rigid part and coverlay dimensions

  • IPC-7351A, Generic Requirements for Surface Mount Design and Land Pattern Standard for footprint (land) design, which is even more important than before because of lead-free processes, especially when components like CSPs (chip scale packages) and QFNs (quad flat no leads) are specified in the BOM list.

  • IPC-A-610F, Acceptability of Electronic Assemblies for acceptability of solder joints and assemblies

  • IPC-2251, Design Guide for the Packaging of High Speed Electronic Circuits and IPC-2141A, Design Guide for High-Speed Controlled Impedance Circuit Boards.With the need to comply with EU Directive 2004/108/EC, and its requirements for high EMC on all PCBs placed in the EU market, SI has become more critical. These standards assist GED designers in selecting microstrip or stripline build up for impedance.

Tool with benefit


The company’s ISO 9002 certification states that Deutsches Institut für Normung e.V. (DIN) and IPC standards serve as the foundation for quality work. IPC standards are required as a tool when the company uses external vendors for bare boards and assembly. For all potential suppliers in Europe, the staff conducts company visits that include an audit of the bare board supplier and their use of IPC standards, especially the IPC-6010 board manufacturing series and IPC-A-600H, Acceptability of Printed Boards. According to Platz, “After visiting hundreds of bare board suppliers, we’ve concluded that the majority of suppliers understand IPC standards but very few can make boards according to IPC Class 3 acceptance criteria. This is absolutely something that needs to improve.”


According to GED, IPC standards are the basis of electronic product quality and reliability. In the design process, technical parameters like choice of base material, pad sizes, spaces/traces and isolation distances between layer and component pitches are constant considerations. The use of IPC standards makes it much easier to find solutions. Without IPC standards, the alternative can involve high repair/touch up costs and lots of scrap but also an imperfect electronic product from a quality and reliability point of view. In some cases, this has been a very costly experience for the company’s customers that have not used IPC standards. Platz gives two examples:


Example 1: Working to improve EMC capabilities on a PCB, a designer placed via holes directly in surface mount pads. The result was years of solder and wetting problems with only an 80 to 90 percent yield and difficult repairs. The designer, by not following the standard, placed vias in a pad that was too tight. The profit loss over several years was estimated to be 50,000 to 60,000 Euros. The company was ultimately able to solve the problem by redesigning via hole placement that improved EMC properties.


Example 2: A complex 12-layer HDI board with BGA components on both sides needed to be manufactured using a lead-free process. After the transfer, yield went down to 50 percent. The reason: wrong design parameters and bad layer configurations were used and pads too small for via holes were created. With a higher lead-free solder temperature, many irreparable barrel cracks were created in via holes. The total loss due to the 50% yield in the lead-free process was more than 100,000 Euros.


For GED, IPC standards have been an invaluable tool over the past two decades. IPC standards not only save money, they also make it easier to communicate with bare board suppliers and assembly companies across the world. IPC standards can significantly reduce mistakes and improve end-product quality and reliability.


What Benefit Do IPC Standards Have For The Electronic Hardware Supply Chain?

World Fuel Cells Market Analysis

World commercial fuel cells spending to more than double by 2017


World fuel cell spending — including research and development funding, investment in fuel cell enterprises, as well as revenue derived from commercial sales — is projected to advance nearly 10 percent per year to $11 billion in 2017 and then almost double through 2022. Commercial demand for fuel cell products and services (including revenues associated with prototyping, demonstration, and test marketing activities, as well as actual product sales) will more than double to $4 billion in 2017 and then nearly triple through 2022. The share of total fuel cell expenditures accounted for by commercial demand will climb from one-fifth in 2012 to more than half of all spending in 2022.


Portable fuel cells to be fastest growing in unit terms


Commercial sales of fuel cell systems are projected to expand from what are currently extremely modest levels to more than three million units in 2022. Demand gains are expected to be strong in most major markets, although explosive growth in sales of portable fuel cell systems will result in their accounting for four-fifths of all unit demand in 2022. Suppliers of portable electronic fuel cell systems will benefit from the advantages that these products offer over battery systems, particularly their ability to generate power over a longer period of time than comparably sized batteries. Declining costs will make fuel cells an affordable alternative source of portable power in a growing number of applications. Nevertheless, portable electronics will remain a modest-sized fuel cell market in value terms, accounting for only three percent of the 2022 dollar total, because demand will be dominated by high volume, low price products.


Motor vehicles to be second largest fuel cells market


Fuel cells used in motor vehicle applications will account for the next largest share of systems sold in 2022, over 10 percent of the total. These will include not only fuel cell-powered automobiles and buses, but also fuel cell range extenders that are being developed for use in electric vehicles. More significantly, fuel cell systems used in motor vehicle applications will account for just under half of total commercial revenue in 2022. In early 2014, Hyundai began leasing fuel cell vehicles to commercial customers, and a number of additional vehicle models are expected to become available from other major automakers by 2017. Dollar demand is projected to rise from current extremely low levels — which at present consist mostly of revenues associated with prototyping, demonstration, and test marketing activities — to much larger but still very modest levels in 2022 relative to overall motor vehicle sales.


Electric power generation uses to continue brisk pace


Electric power generation has experienced the most extensive commercialization activity of any fuel cell application to date. In 2012, electric power generation accounted for roughly three-fourths of all commercial revenue and more than half of the total number of units sold, with strong growth in both large-scale megawatt applications and small residential micro combined heat and power units recorded between 2007 and 2012. Electric power generation-related fuel cell sales will continue to grow at a brisk pace through 2022, bolstered by comparatively low hurdles to overcome to achieve cost competitiveness and much greater fuel efficiency than conventional power generation methods.


Details of the new report, table of contents and ordering information can be found on Electronics.ca Publications’ web site.  View the report: World Fuel Cells to 2017.


World Fuel Cells Market Analysis

Monday, April 6, 2015

Semiconductor ATE Market Analysis

Global market for Semiconductor ATE is forecast to reach US$4.3 billion by 2020, spurred by strong chip fabrication activity against a backdrop of growing demand for electronic chips in consumer, industrial, automotive and medical electronics. Demand for Semiconductor Automated Test Equipment (ATE) is intrinsically linked to the level of semiconductor fabrication activity, which in turn is largely influenced by the health of the global electronics industry.


After a major setback during the 2007-2009 recession period, the global semiconductor ATE market made a strong rebound in the year 2010. The recovery soon after was however marred by weak financial climate in Europe and natural calamities in Japan, which disrupted the global supply chain. Rising cost of production, price sensitive end-use markets and the resulting shrinking profit margins accelerated the consolidation trend among semiconductor ATE vendors. Steadily recovering global economic growth, strong gains in manufacturing and PMI performance, are however expected to drive growth in the coming years. Need for additional capacity, as a result of increased outsourcing of fabrication activity, is resulting in increased investments in new fab constructions in Asia, which in turn is expected to drive demand for semiconductor ATE.


Fabrication companies are under constant pressure to employ latest technology to design and manufacture advanced ICs to meet the complexity challenges of silicon chips as they grow in performance in parallel with the Moore’s Law. Semiconductor ATE, under this scenario is assuming increasing importance. The software centric approach to automated testing is expected to emerge as a game changer in the ATE industry, with vendors increasingly using software as a tool for differentiating product offerings. Miniaturization, digitalization and high-speed computing represent trends in the electronics industry which are benefiting the market for semiconductor ATE. Increase in demand for ASICs and NAND flash memory devices as a result of growing adoption of tablet PCs and smartphones, increase in DRAM sales in line with resurgence in demand for PCs also continues to induce strong demand for semiconductors and semiconductor production equipment including ATE.


Boundary Scan (BS) ATE, also known as BS controllers, and functional ATEs are driving growth in the PCB ATE market. The telecom industry is currently a hotbed for innovation, with demand for testing instruments anticipated to rise supported by increased R&D spending on wireless technologies for next-gen solutions. Robust demand for SoCs for use in portable communication devices is additionally anticipated to continue to spur growth in the global semiconductor ATE market. FPGA based DSPs is fast becoming a mainstay for advanced RF Test equipment with user programmable measurement algorithms on FPGA expected to take T&M instruments to the next level. PLX and other on-chip testing technologies are gaining popularity among fabricators across the globe.


As stated by the new market research report on Semiconductor Automated Test Equipment (ATE), Taiwan represents the single largest regional market worldwide. The country also represents one of the fastest growing markets with a CAGR of 7.2% over the analysis period.


Major players covered in the report include Advantest Corporation, Aeroflex Inc., AMC Technology LLC, Astronics Test Systems Inc., Chroma ATE Inc., CREA (Collaudi Elettronici Automatizzati S.r.l.), LTX-Credence Corporation, Marvin Test Solutions Inc., National Instruments Corporation , Roos Instruments Inc., STAr Technologies Inc., and Teradyne Inc.


The research report titled “Semiconductor Automated Test Equipment (ATE) – Global Strategic Business Report”, provides a comprehensive review of market trends, growth drivers, technological trends, major challenges, mergers, acquisitions and other strategic industry activities. The report provides market estimates and projections for major geographic markets including the US, Japan, Europe, China, South Korea, Taiwan, and Rest of World.


Semiconductor ATE Market Analysis

Optical Transceivers Markets to Reach $9.9 Billion by 2020

ELECTRONICS.CA PUBLICATIONS announces the availability of a new report entitled “Optical Transceivers: Market Shares, Strategy, and Forecasts, Worldwide, 2014 to 2020″. The global optical transceivers markets at $3.2 billion in 2013 is anticipated to grow to $9.9 billion by 2020 driven by the availability and cost effectiveness of 40 Gbps, 100 Gbps, and 400 Gbps devices. Next generation devices use less power, are less expensive, and are smaller. The adoption of widespread use of the 100 Gbps devices, and the vast increases in Internet traffic are core to change in the communications infrastructure markets. The vendors in the optical transceivers industry have to invest in high-quality technology and processes. The development of innovative products is essential to keeping and growing market share.


High-speed serial transceivers form the backbone of networks. Communications, servers and many other electronic systems depend on high-speed serial transceivers. Global adoption of the Internet is driving rapid growth of the mega datacenter. Data centers support online commerce, streaming video, social networking, and cloud services. Software as a Service (SaaS) is a primary offering.


Leading vendors offer a broad product selection. They are positioned with innovative technology. Optical module manufacturers address the needs of all major networking equipment vendors worldwide. Leading vendors have taken a leading role in transforming the data communications and tele-communications equipment market.


The shift has been away from utilizing discrete optical components to leveraging the design and pay-as-you-grow flexibility offered by pluggable modules. Optical transceiver products are compliant with Ethernet, Fibre Channel, SONET/SDH/OTN and PON standards. They generally operate at data rates of 10 Gb/s, 40 Gb/s and 100 Gb/s.


Transmitter / Transceivers are capable of distances ranging from very short reach within a datacenter to campus, access, metro, and long-haul reaches. They feature outstanding performance. Units work over extended voltage and temperature ranges. They are positioned to minimize jitter, electromagnetic interference (EMI) and power dissipation.


Optical transceiver components are an innovation engine for the network. Optical transceiver components support and enable low-cost transport throughout the network. Optical transceivers are needed for high speed network infrastructure build-outs. These are both for carriers and data centers. Network infrastructure build-out depends on the availability of consultants who are knowledgeable.


Consultants with extensive experience are needed to bring optical component network design, installation, upgrade and maintenance into development. Optical components are being used to equip data centers, FTTx, metro access or core networks. They are used for long-haul and WAN.


A palette of pluggable optical transceivers includes GBIC, SFP, XFP, SFP+, X2, CFP form factors. These are able to accommodate a wide range of link spans. Vendors work closely with network planners and infrastructure managers to design high speed optical transport systems.


According to Susan Eustis, lead author of the WinterGreen Research team that prepared the study, “The DP-QPSK is the industry-backed modulation scheme for 100Gbps. Commonality between 40Gbps and 100Gbps coherent designs bring a design choice to the issue is relative costs. The economics of 40 Gbps versus 100 Gbps coherent are matters of comparison. If users buy 40 Gbps and an economical 100 Gbps coherent design appears, 40 Gbps coherent get the required market traction to create economies of scale that market the 40Gbps devices viable in the market.”


Designers are shrinking existing 40Gbps modules, boosting 40Gbps system capacity. The 300-pin LFF transponder, at 7×5 inch, requires its own line card. Two system line cards are needed for a 40Gbps link: one for the short-reach, client-side interface and one for the line-side transponder.


Details of the new report, table of contents and ordering information can be found on Electronics.ca Publications’ web site.  View the report:  “Optical Transceivers: Market Shares, Strategy, and Forecasts, Worldwide, 2014 to 2020“.


Optical Transceivers Markets to Reach $9.9 Billion by 2020

Friday, April 3, 2015

Download IPC Standards - Everything You Need From Start To Finish

To achieve a high quality end product and maintain a competitive position in the marketplace, you need to infuse quality throughout the manufacturing process.


Did you know there is an IPC standard associated with nearly every step of printed circuit board production and assembly?  From design and purchasing to assembly and acceptance, Electronics.ca Publications offers IPC Standards to help you assure superior quality, reliability and consistency in the electronic assemblies that go into your product. Download IPC Standards Spec Tree – PDF file.


As with the manufacturing process — which uses a step-by-step approach – IPC standards also build upon one another. To achieve your desired results, it’s important to implement the appropriate IPC standards associated with each step of production.


Why Use IPC Standards in Your Manufacturing Process?


  • Gain Control Over End Product Quality and Reliability — Quality and reliability are the cornerstones of competing in the marketplace and critical to your company’s reputation and profitability. By implementing IPC standards throughout the manufacturing process, you help ensure better performance, longer life and compliance with lead-free regulations.

  • Improve Communication with Suppliers and Employees — IPC standards are the standards that your competitors, suppliers and EMS providers use. Working from an established IPC standard helps all of you to “speak the same language” — the language of the global electronic industry. In addition, using IPC standards eliminates confusion for employees, because they know they need to perform to an established industry standard.

  • Help Contain Costs — Ensuring that your design and the bare boards you purchase comply with IPC standards allows you to produce electronic assemblies that meet stringent quality tests down the line, minimizing costly delays, rework and scrap.

The Most Popular IPC Documents are available from Electronics.ca Publications in PDF Format


Download IPC Standards


IPC A-610F – Acceptability of Electronic Assemblies
IPC-A-610 is the most widely used electronics assembly standard in the world. A must for all quality assurance and assembly departments.


IPC J-STD-001F – Requirements for Soldered Electrical and Electronic Assemblies
J-STD-001 Requirements for Soldered Electrical and Electronic Assemblies has emerged as the preeminent authority for electronics assembly manufacturing. The standard describes materials, methods and verification criteria for producing high quality soldered interconnections. The standard emphasizes process control and sets industry-consensus requirements for a broad range of electronic products. This revision now includes support for lead free manufacturing.


IPC A-620B – Requirements and Acceptance for Cable and Wire Harness Assemblies
Revision B is now available for the only industry-consensus standard for Requirements and Acceptance of Cable and Wire Harness Assemblies.


IPC-DRM-PTH-E
Now updated to Revision D of the latest IPC-A-610E and J-STD-001E – our Training & Reference Guide illustrates critical acceptance criteria for the evaluation of through-hole solder connections.


IPC-DRM-SMT-E
Useful as a training aid in the classroom or on the shop floor, DRM-SMT-E contains computer generated color illustrations of Chip component, Gull Wing and J-Lead solder joints.


IPC-J-STD-033C
J-STD-033 Provides Surface Mount Device manufacturers and users with standardized methods for handling, packing, shipping and use of moisture/reflow sensitive SMDs.


IPC-J-STD-020D-1
IPC-J-STD-020D-1 standard identifies the classification levels of nonhermetic solid state surface mount devices that are sensitive to moisture-induced stress.


J-STD-075

J-STD-075 provides test methods to classify worst-case thermal process limitations for electronic components. Classification is referenced to common industry wave and reflow solder profiles including lead-free processing.


IPC Collections:


IPC-C-103 – Electronics Assembly Standards Collection


IPC-C-1000 Essential Document Collection for Board Design, Assembly and Manufacture


IPC-C-108 Cleaning Guides and Handbooks Collection


Through Electronics.ca you can order IPC standards for printed circuit board design and manufacturing and electronics assembly, including handbooks, guidelines and IPC training videos.


Download IPC Standards - Everything You Need From Start To Finish

DSL and G.fast Chips Markets To Reach $4.7 Billion By 2020

ELECTRONICS.CA PUBLICATIONS announces the availability of a new report entitled “DSL and G.fast Chips: Market Shares, Strategy, and Forecasts, Worldwide, 2014 to 2020″. The 2014 study has 319 pages, 109 tables and figures. Worldwide DSL and G.fast Chips markets are increasingly diversified, poised to achieve significant growth as broadband is used in every industry segment.


End to end broadband networks leverage a combination of optical infrastructure in the long haul and copper infrastructure in the last few meters from the distribution box to the home. Fiber has had rapid advance but does not work in the end, it is too expensive to the home. FTTH is too expensive and DSL continues to be a viable alternative, with DSL set to be replaced at the high end initially by G.fast. Copper based broadband technologies promise to last for a long long time. Though for many years FTTH has threatened to make xDSL obsolete, this has not proven to be the case.


Copper represents an installed infrastructure worth trillions and too expensive to just replace. Fiber is too expensive to use it to replace all the copper. FTTH DSL and G.fast, the copper works in many cases and does not need to be repplaced. xDSL markets will be strong for some long time to come as copper remains a transport line.


Copper is everywhere in the telecommunications network. It is still the primary wireless backbone transport means, meaning it continues to be vital as new wireless systems continue to expand their markets. It predominates in the local loop, creating demand for systems that are able to support high speed signal transport over copper wire.


Copper based broadband is and will remain for the foreseeable future, the dominant broadband access technology across the globe. Broadband service providers who rely on copper loops for broadband access have to improve broadband performance and extend its life.


Choices between DSL technologies and G.fast are based on cost. Fiber technologies are used to come to the curb. DSL and G.fast represent a hybrid rooted in a network planning.


Copper based broadband continues to be the dominant broadband access technology across the globe. Broadband service providers who rely on copper loops for broadband access have options to improve broadband performance and extend their life. Despite its throughput limitations, considerable research and development is taking place to improve DSL performance.


Cable boasts faster speed than DSL Internet i. However, cable does not always deliver on the promise in everyday practical use. Cable technology supports 30 Mbps of bandwidth, whereas most forms of DSL cannot reach 10 Mbps.


One type of DSL technology, VDSL, can match cable’s performance, also supporting 30 Mbps. However, Internet service providers generally do not offer VDSL, but rather the cheaper and slower ADSL or SDSL services. Cable modem services can slow down significantly if many people in your neighborhood access the Internet simultaneously.


The opportunity to participate in DSL and G.fast Chips markets is compelling illustration of the ability to leverage seemingly outdated copper infrastructure to breathe new life into existing investment. This market is evolving as new technology and vectoring are implemented, based on breakthroughs and innovation. Technology platforms are rapidly evolving.


Consideration of DSL and G.fast chips market forecasts indicates that markets at $939 million will reach $4.7 billion by 2020. Growth comes as every industry achieves leveraging broadband to make social media and smart phones work to grow the business. DSL and G.fast are able to make the benefits of broadband available to consumers and support network flexibility for the modern enterprise. DSL and G.fast networks are flexible and able to reach customers on the go. Broadband is used for video and entertainment delivery.


DSL and G.fast Chips Markets

DSL and G.fast Chips Markets


Details of the new report, table of contents and ordering information can be found on Electronics.ca Publications’ web site.  View the report: “DSL and G-fast Chips: Market Shares, Strategies, and Forecasts, Worldwide, 2014 to 2020“.


G.fast, G.fast vectoring, DSL, Digital Subscriber Line, DSL Chips, G.fast, DSL Vectoring, Access Providers, G.fast Vectoring, Broadband, Telecom, Copper plant, Fiber to the Neighborhood, DSLAM, End to End Optical, Broadband Networks, Data And Video Traffic, Mixed Signal Integrated Circuits, ADSL, VDSL, DSL, xDSL, Digital, Subscriber Line (DSL), Data And Video Traffic, Flexible Network Interfaces, FTTH, Advanced Bonding


DSL and G.fast Chips Markets To Reach $4.7 Billion By 2020

Wednesday, April 1, 2015

Global Market for Transformers to Reach $48.3 Billion in 2019

ELECTRONICS.CA PUBLICATIONS announces the availability of a new report entitled “Global Markets for Transformers“.  The global transformers market is expected to grow to $48.3 billion by 2019, with a five-year compound annual growth rate (CAGR) of 7.3%.  The Asia-Pacific market, the fastest-growing region of the overall market, is moving at a significant 8.1% CAGR.


Tasked with the regulation of voltage output, transformers are critical to the electricity supply chain. Globally, the demand for this technology is driven by the increasing demand for electricity, replacement of older transformers, and environmental concerns, particularly in India and China.


Indeed, the Asia-Pacific region is the largest and fastest growing segment of the global market. Valued at just $13.2 billion in 2013, the Asia-Pacific market is expected to surge to $21.1 billion by 2019. Such rapid growth is attributed to improving economic conditions and the increasing use of the region as a hub for Western markets to outsource the manufacture of their transformers.


Meanwhile, the European and North American markets are projected to grow at a healthy CAGR of 7.2% and 5%, respectively.


The upgrading of existing networks and replacement of older transformers in Western regions offer a huge growth opportunity for the transformer market. This is especially the case for power and traction transformers, which have high performance properties to increase energy efficiency and reduce electricity losses. However, in the longer-term, the developing regions, including China, Brazil, India and others, will create huge opportunities for the transformer market with the increasing demand for electricity and increasing electricity production.


Increasing raw material prices and stricter environmental regulations on carbon emission levels have forced companies to focus on the development of advanced transmission technologies that will comply with current and future environmental regulations. The pressure to develop environmentally friendly transformers is increasing even in the Asia-Pacific and other developing regions.


GLOBAL MARKETS FOR TRANSFORMERS provides an overview of the global markets for transformers and related technologies. It includes analyses of global market trends, with data from 2013, estimates for 2014, and projections of CAGRs through 2019.


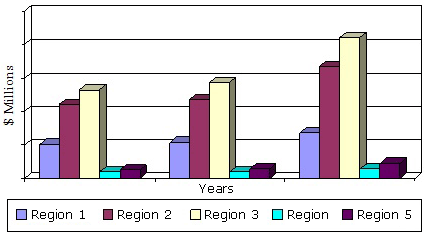
SAMPLE FIGURE

GLOBAL TRENDS OF THE HYDRAULIC PUMP MARKET BY REGION, THROUGH 2019

($ MILLIONS)


GLOBAL TRENDS OF THE HYDRAULIC PUMP MARKET BY REGION, THROUGH 2019

Global Markets for Transformers


Details of the new report, table of contents and ordering information can be found on Electronics.ca Publications’ web site.  View the report: Global Markets for Transformers.


Global Market for Transformers to Reach $48.3 Billion in 2019